Every year, the California Commission on Disability Access releases its Annual Report to the Legislature. The 2019 report consists of 38 pages this year and seems to show trends continuing in the same direction. This post will break down this year’s report. CCDA’s website can be found at https://www.dgs.ca.gov/ccda. Alternatively, you can download the full report here.
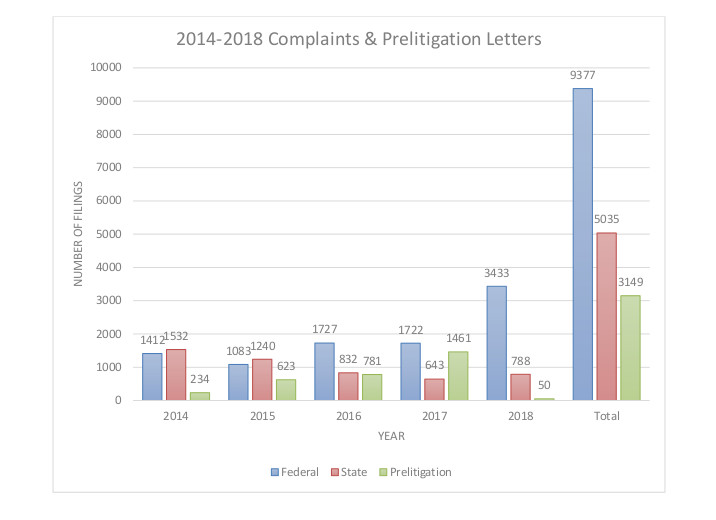
Federal complaints outnumbered state complaints every year since 2016. In 2017, federal complaints made up 73% of all those reported. 2018 saw that number increase to 81%. More than 4 times as many federal cases were filed than state. CCDA speculates that California Civil Code §55.3 and federal court expediency (2-6 months in federal court vs. 12-24 months in state court) may be driving this trend.
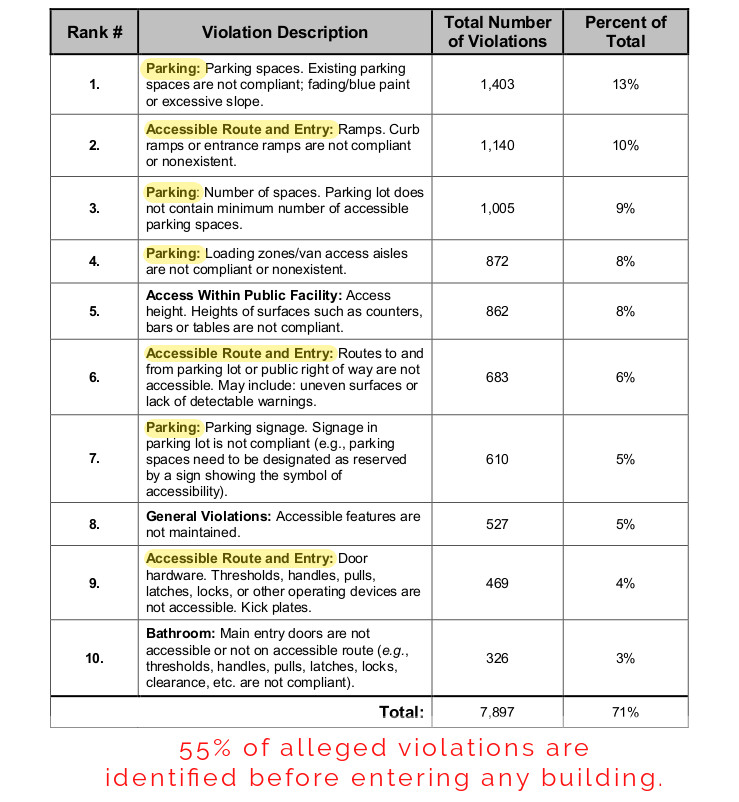
Most frequently alleged construction violations continue to be parking, making up 35% of all allegations. Accessible route and entry to a building make up 20%, access within the facility 8%, while general violations and bathroom violations round out the the categories at 5% and 3% respectively. Parking and access route have been staples to the report since 2014. The first thing anyone sees when entering your building is parking and the access to your building. If you’re unable to enter a building, you’re unable to spend your dollars there.
Facing ADA parking complaints, citations, threats?
Ensure your first impression is code compliant.
Contact us today to schedule an inspection.
Sales or rental establishments (e.g., apartment leasing office, grocery store, shopping center) made up 31% of all alleged violations with food service (e.g., restaurant, bar, food truck) a close second at 28%. Service establishments (e.g., pharmacy, bank, gas station) made up 24% with hotels, motels, inns, etc. a distant third with 15%. Reviewing Table 6 (page 23 of the report), it seems to us that franchise locations receive no reprieve. All (148 case files reviewed) of the Top 10 Most Frequent Defendants with Alleged Violations identified are franchise locations or gas stations.
Here’s an easy one. Santa Clara County and Los Angeles County make up 7 of 8 of the Top 8 ZIP Codes of Complaints Received. Did we mention we’re based in Los Angeles County? We have been inspecting construction in Los Angeles County for well over 10 years. Oh, and Costa Mesa of Orange County ranked 8th on this list.
Self-identified high-frequency litigants tripled the number of complaints from 98 to 302 of the 788 state complaints in 2018. A total of five law firms made up 79% of 4,221 state and federal complaints. CCDA noted that one law firm in particular, unnamed, made up 49% of all complaints. With so much data from one firm, skewed data is a noted concern.
83% of all cases appear settled, 9% being dismissed, and the remaining 8% resulting in judgement. According to this linked article, 95% of all personal injury cases result in a pre-trial settlement. Of those that aren’t settled, 90% result in a judgement in favor of the plaintiff, the individual who brought the suit. That doesn’t seem to be the case for the 9% of cases that are dismissed (If we have misunderstood this jargon, please let us know!). Only 2% of defendants who found themselves in court requested an early evaluation conference in 2016, 2017, or 2018. The number of those who requested a site inspection doubled from 2017 to a total of…dun dun dun…4%. The plaintiff received damages or monetary settlement in 95% of reported cases, up from 93% in 2017. Take these number with a grain of salt though. CCDA noted the following:
“As discovered in 2018, law firms do not reliably answer every question on the CRR form, which causes inconsistencies between the total number of answers for each question.” — CCDA 2018 Annual Report to the Legislature
Contact Us For Additional Information.
Let me leave you with the list CCDA’s Top 10 Alleged Violations.